.gif)


 uh31.dpri.kyoto-u.ac.jp
.gif)
Tower data <preliminary value>
Weather and oceanographic observed data at Tanabe-Nakashima oceanographic observation tower installed in Tanabe Bay are shown below.
Weather data
※ The above data indicate the averaged value from 00 minutes to 10 minutes in every hour.
※ Sampling interval of IRT measurement is 10Hz, other measurements are 1Hz.
※ Wind speed and direction are measured by propeller anemometer at the tower. The wind direction indicates north wind at an angle of 0 degrees, and clockwise direction.
【Wind speed and direction】
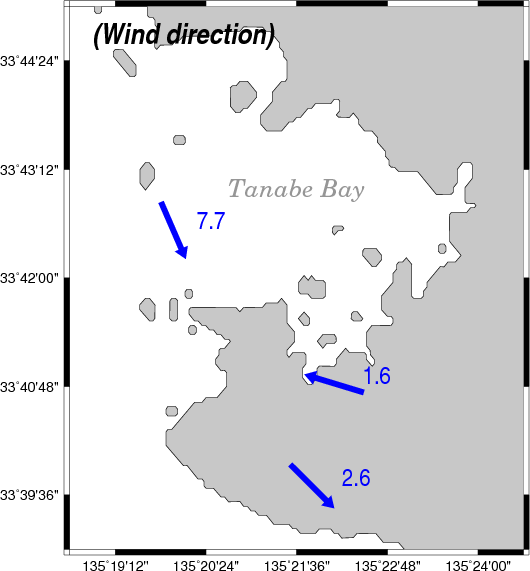
※ The arrows indicate wind direction and the blue numbers show wind speed values (m/s) measured at each observation points.
【Air temperature and humidity】
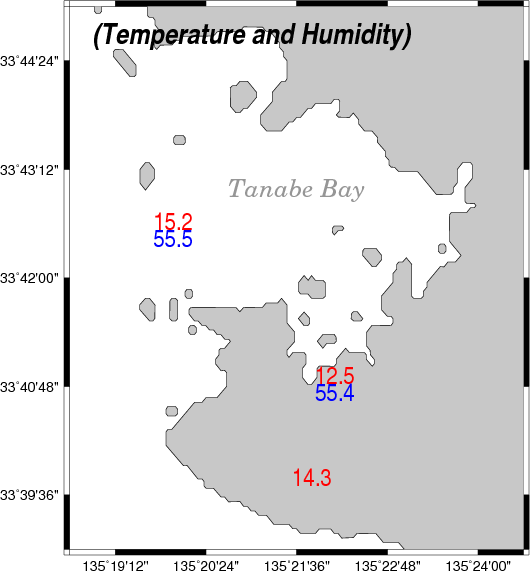
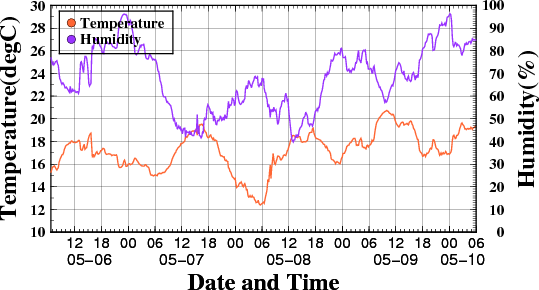
※ The red numbers indicate the measured air temperature(deg.C) and the blue numbers indicate the humidity(%).
※Click here for more information!
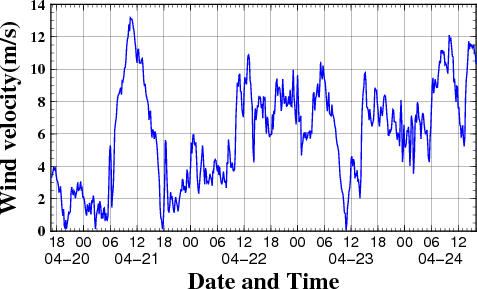
Time Series Graph
【Wind speed】
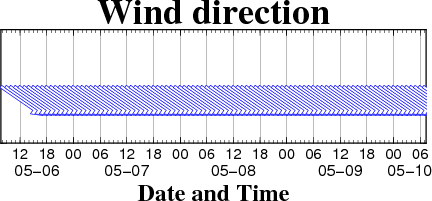
【Wind direction】
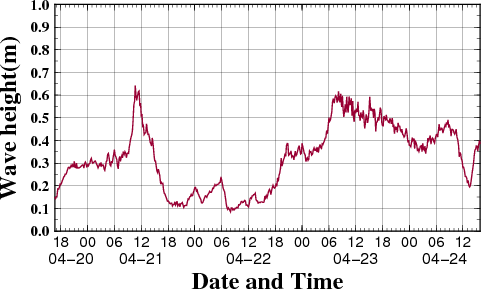
【Wave height】
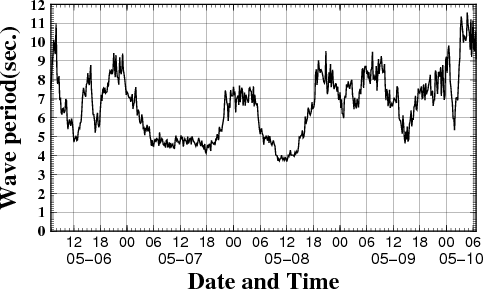
【Wave period】
【Air temperature and humidity】
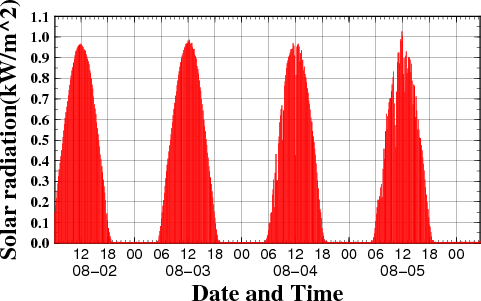
【Solar radiation】
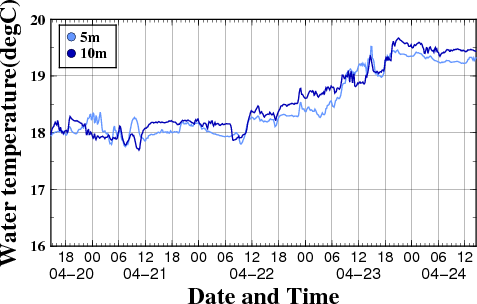
【Water temperature】
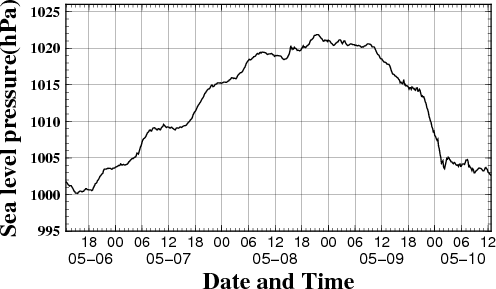
【Sea level pressure】
※The precision of above data are not guaranteed owing to lack of verification process in order to provide a prompt report(preliminary results).
※These observed data have been accumulated in the form of daily report and monthly report, which are icluding mean and maximum value.
※Please note that we can not be responsible for any loss, damages and troubles on your activity, which were carried out based on this website data.