研究内容
In a sediment transport system from mountainous areas through river areas to coastal areas, disasters occur due to the various kinds of sediment transport phenomena. The phenomena and processes are important factors to produce a safe, sound sediment environment in the river basin. To mitigate the disasters and to understand the dynamics of sediment transport and water in the sediment transport system, various field observations, hydraulic experiments, and the development of simulation models and systems are carried out in our division.
Landslides, debris flow, woody debris, and channel deformation cause sediment disasters. Recently, sedimentation and flood damage have become serious problems, in which sediment generated in mountainous areas moves downstream, burying channels and causing damage. Sediment disaster prevention is one of the important social topics. Our laboratory researches the generation mechanism, prediction techniques, upgrading hazard maps with various field observations, hydraulic experiments, and development of simulation models and systems. Recently, numerical simulations have been applied to detail hazard zoning and to consider effective countermeasures. Figure 1 shows the numerical analysis results of debris flow deposition in mountainous housing areas (left) and sediment and flood damage simulation results (right).
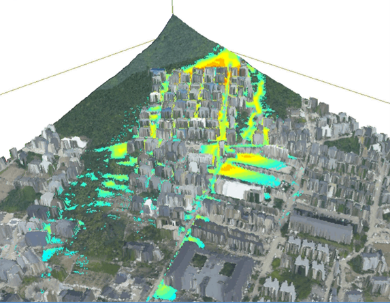
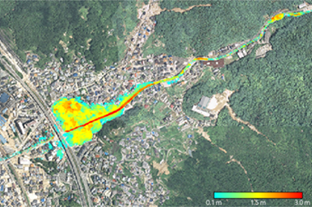
Fig. 1: Debris flow simulation result(left) and sediment and flood damage simulation result (right).
The debris flow mechanism is not fully understood due to the severe phenomena. We conduct field observations of fine sediment contents within debris flows, which contribute to elucidating the debris flow mechanism and simulation model improvement. Figure 2 shows our observation equipment installed in a debris flow-prone stream to observe the fine sediment content rate in debris flow.
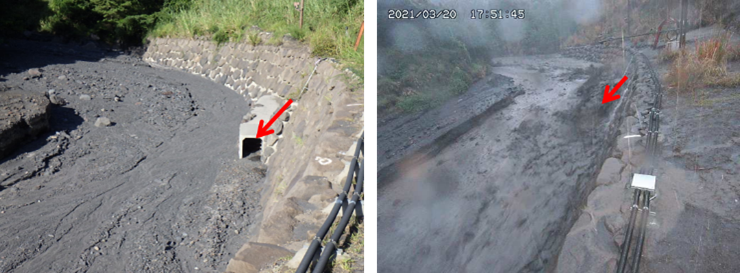
Fig. 2: Observation equipment in a debris flow-prone stream.
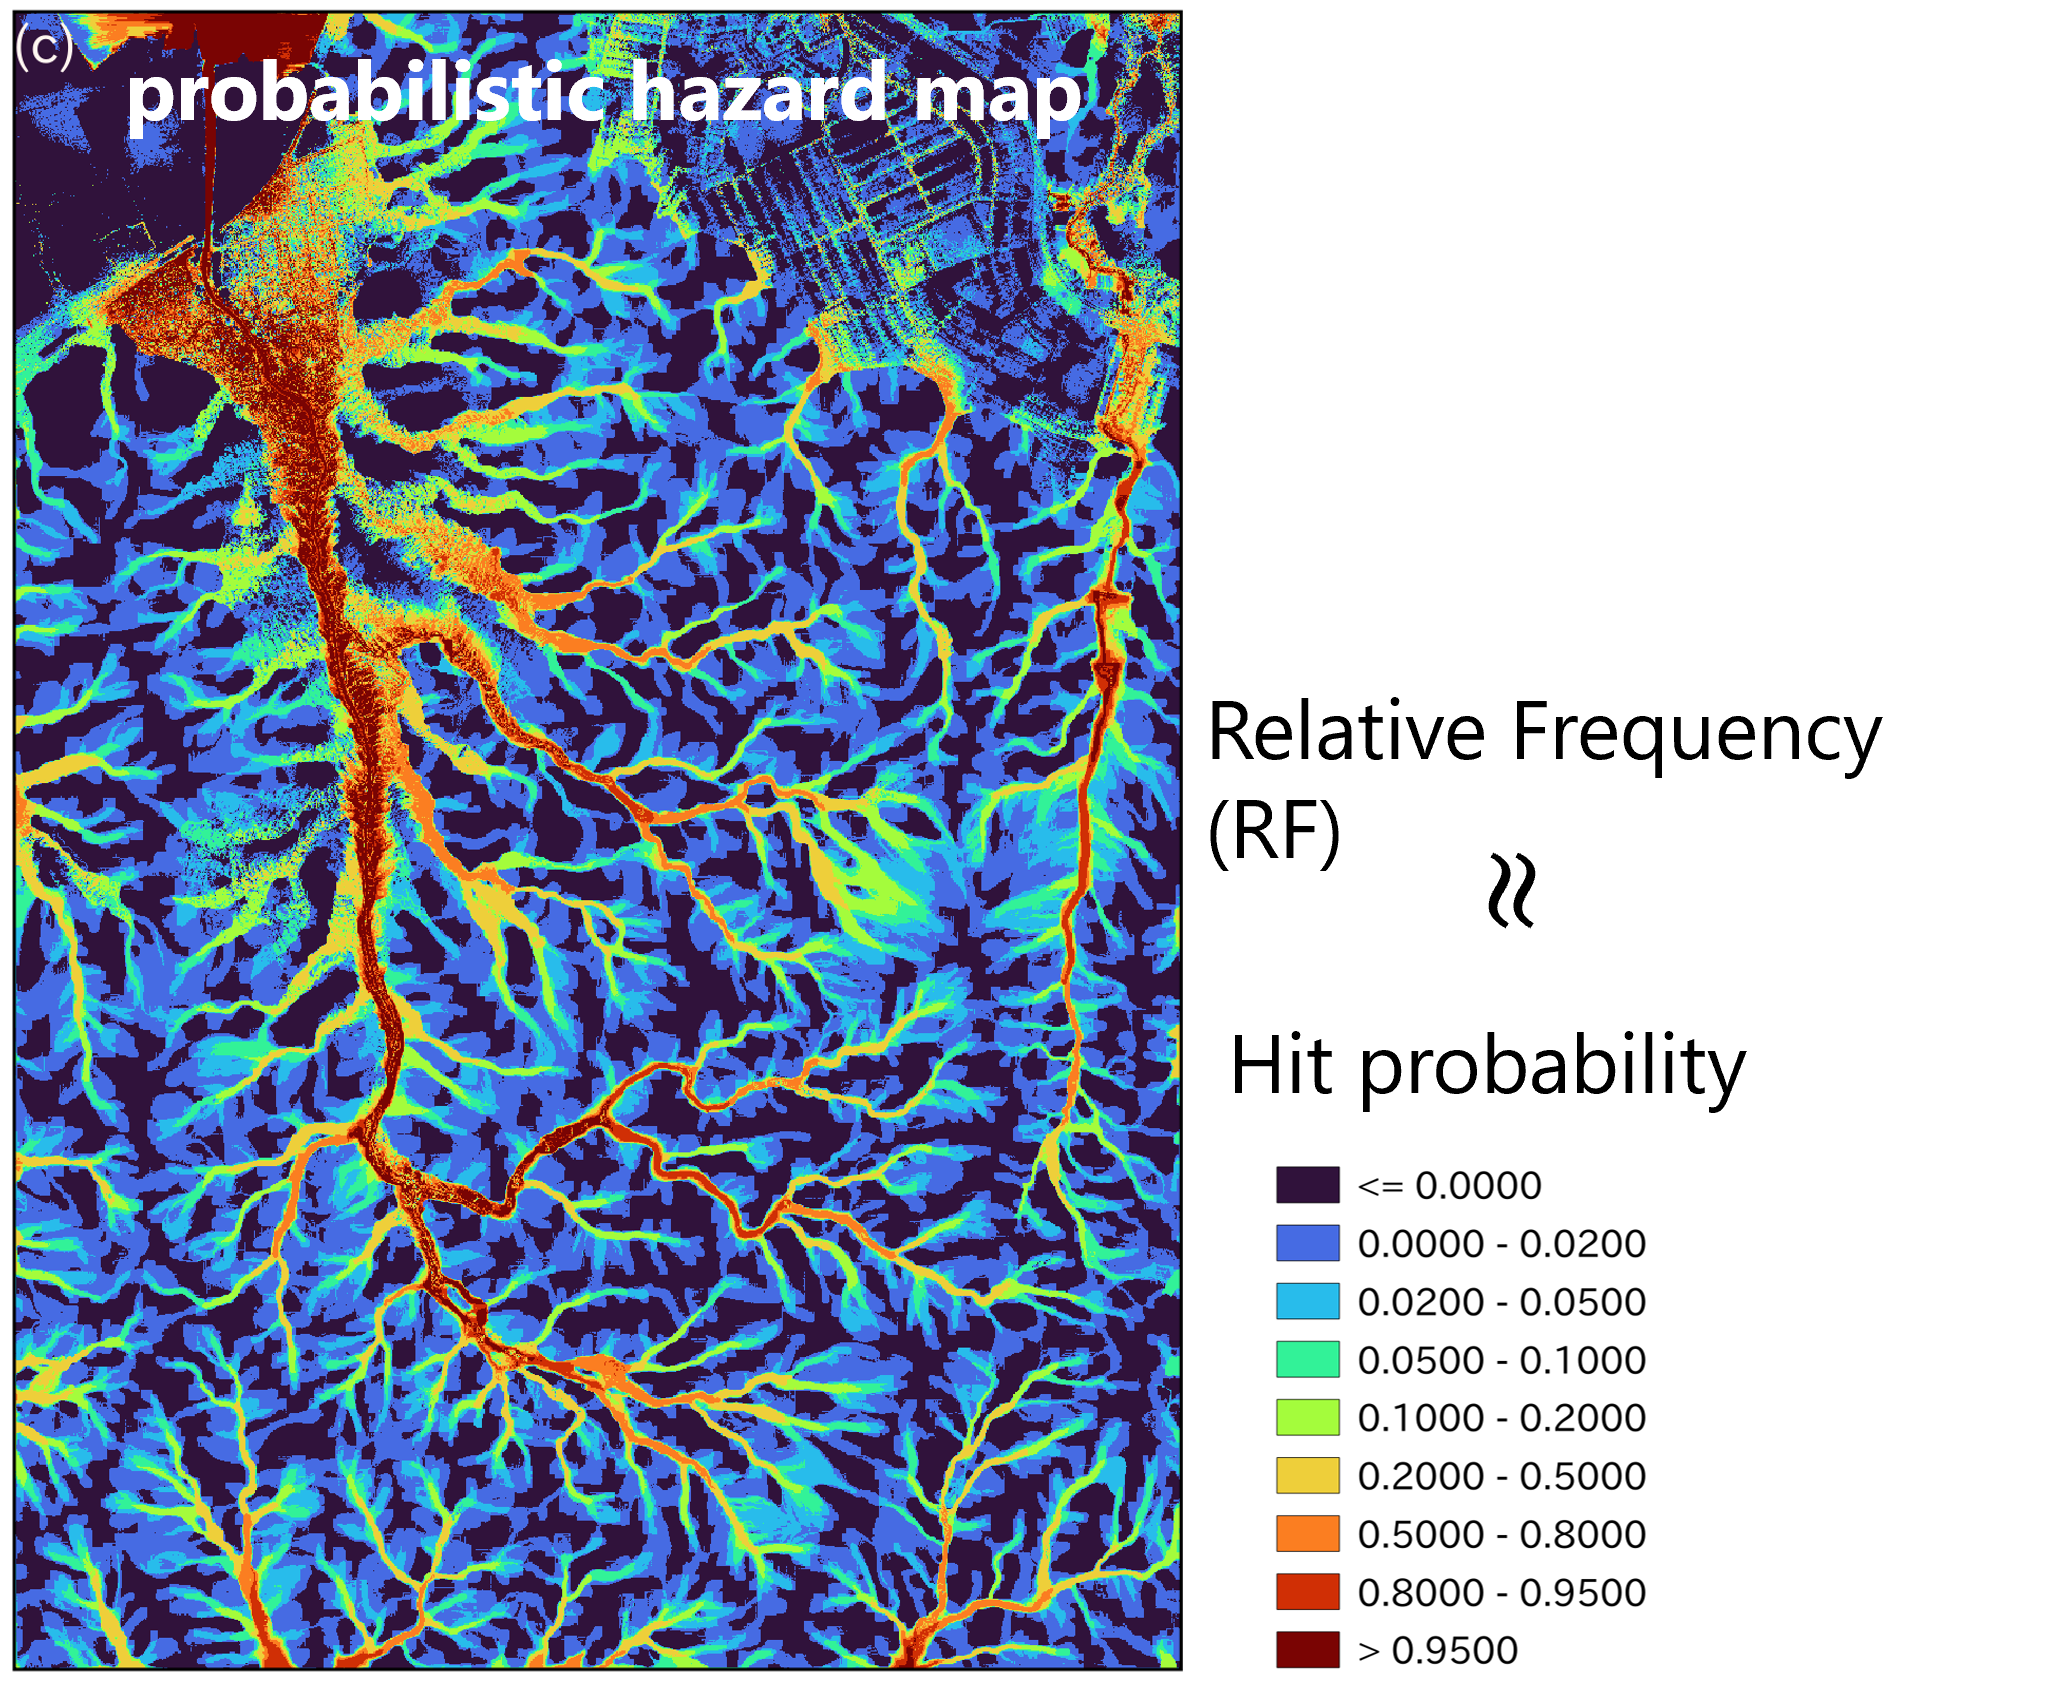
Fig.: Hit probability estimated by debris-flow ensemble simulation. [Yamanoi et al., 2022, arXiv:2211.06837]
Debris-flow hazard maps in Japan are represented in two colors, the so-called yellow zone and the red zone, and it is impossible to know the difference in hazards in the area. Therefore, we are developing a methodology to predict the damaged area of a debris flow as a hit probability by employing ensemble debris flow simulation using the probability of appearance of the starting point of a debris flow estimated by a statistical method using rainfall and topographical conditions as input conditions.
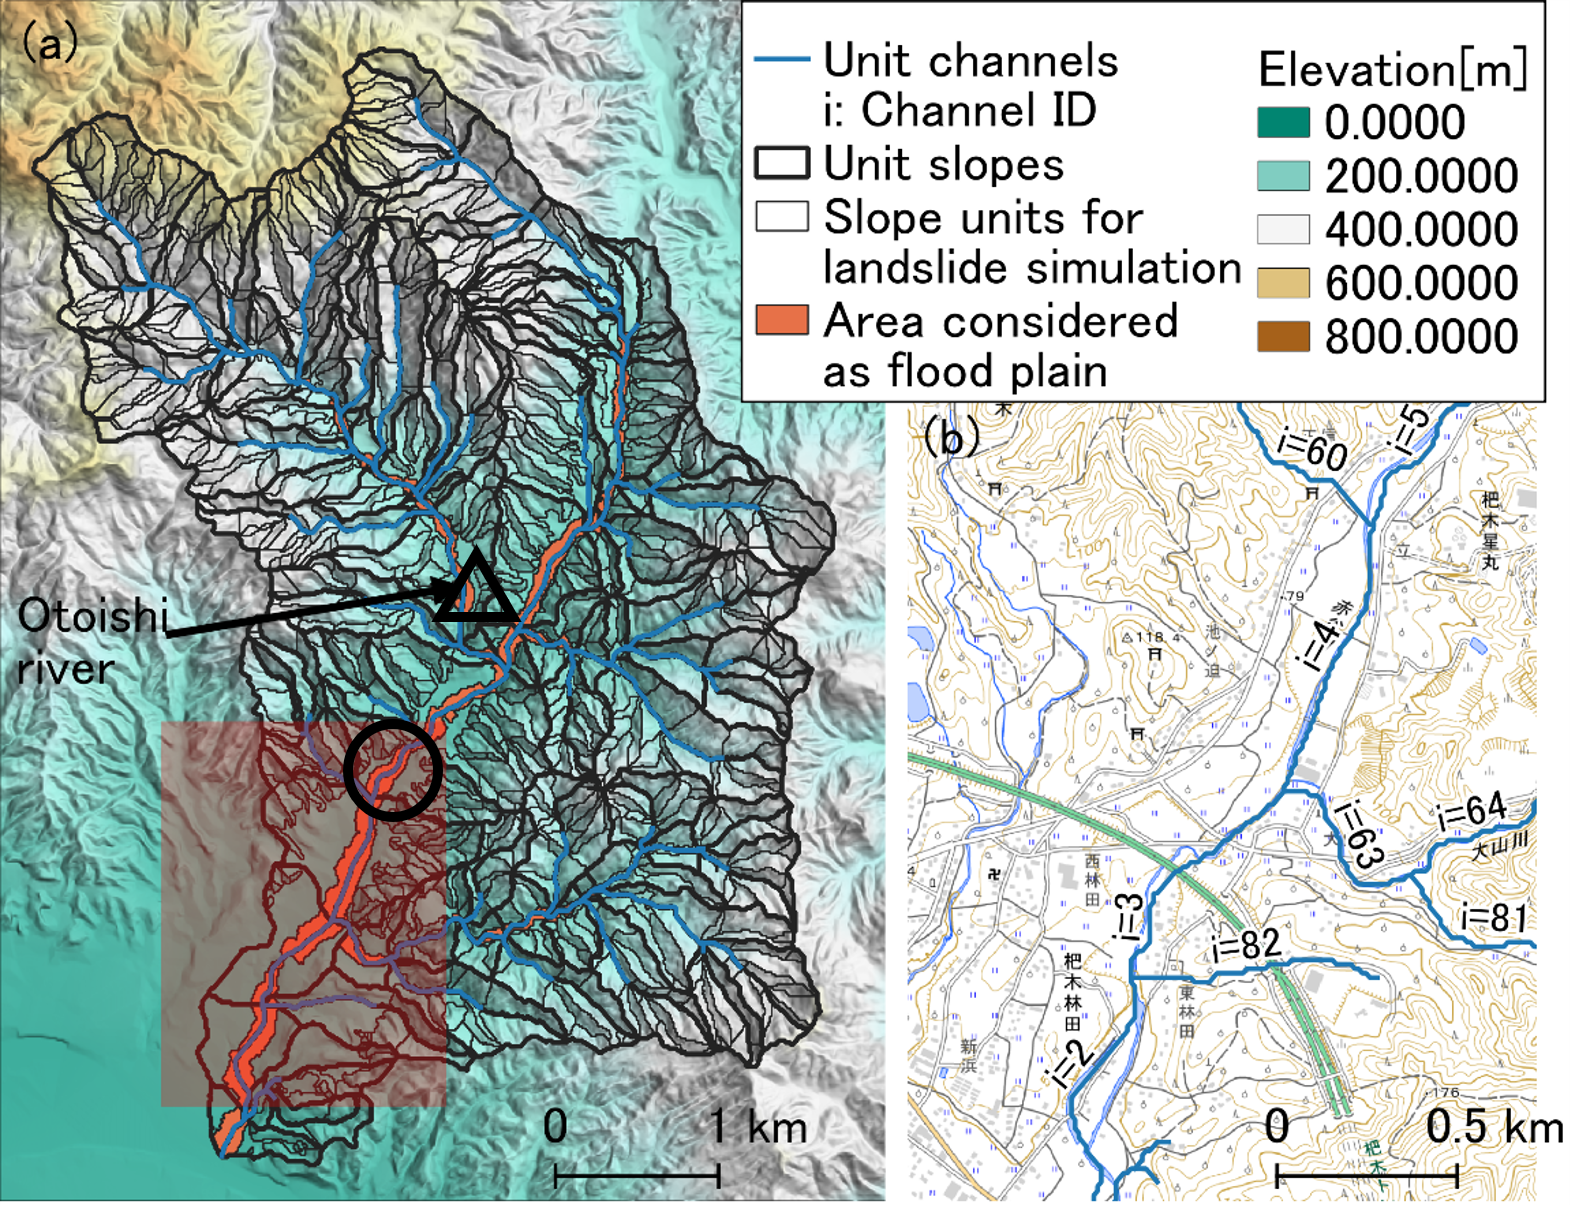
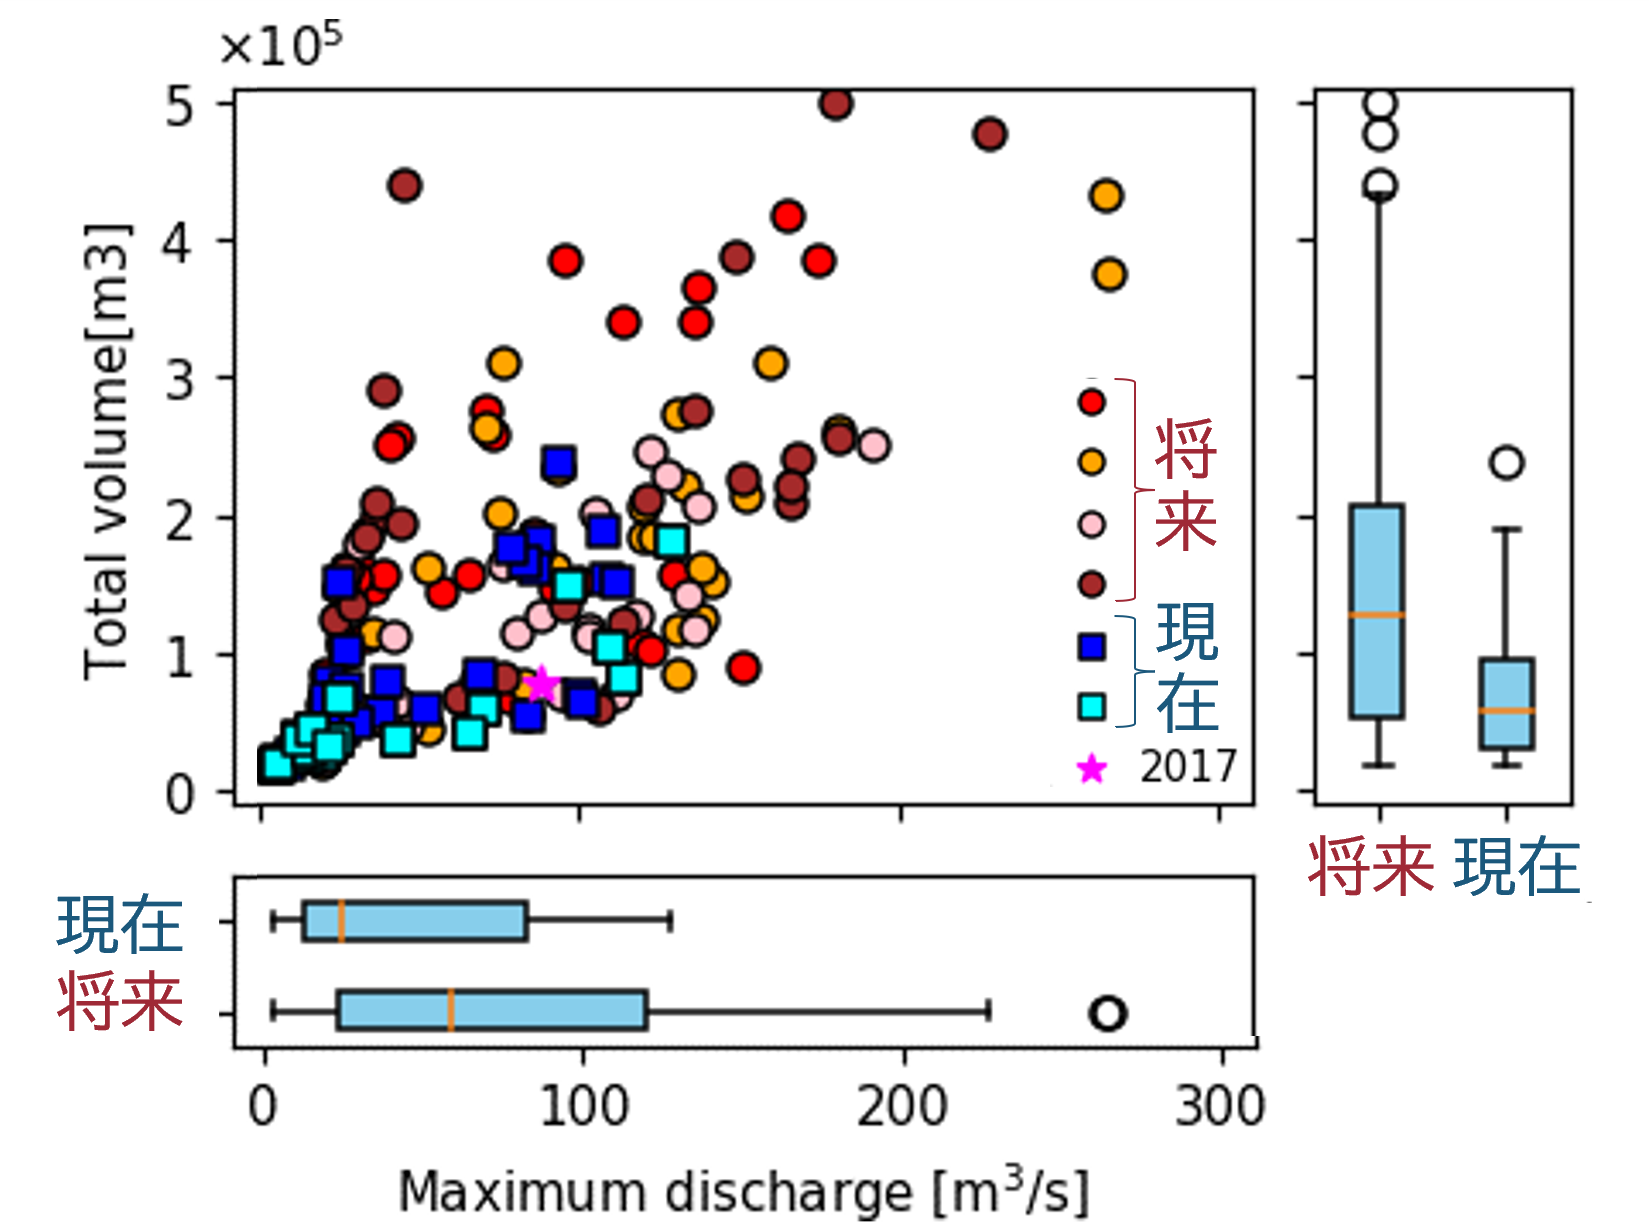
Figure: Relationship between simulated maximum water discharge and sediment production volume in the Otoishi River catchment (left panel △), which was affected by the 2017 Northern Kyushu Heavy Rainfall. [ Yamanoi et al., 2021, Journal of JSCE, Ser. B1 (Hydraulic Engineering) ]
Under the influence of climate change, both frequency and characteristics of sediment-related disaster may change in Japan. Our laboratory is engaged in research to assess the impact of such changes using the numerical simulation. The figure shows the relationship between sediment production and maximum flow discharge plotted for each rainfall event obtained by SiMHiS, an integrated simulation of sediment production and sediment runoff, given heavy rainfall data by the regional climate model. This result indicates that large sediment production and flow dischrage that do not exist in the current climate could occur in the future climate.
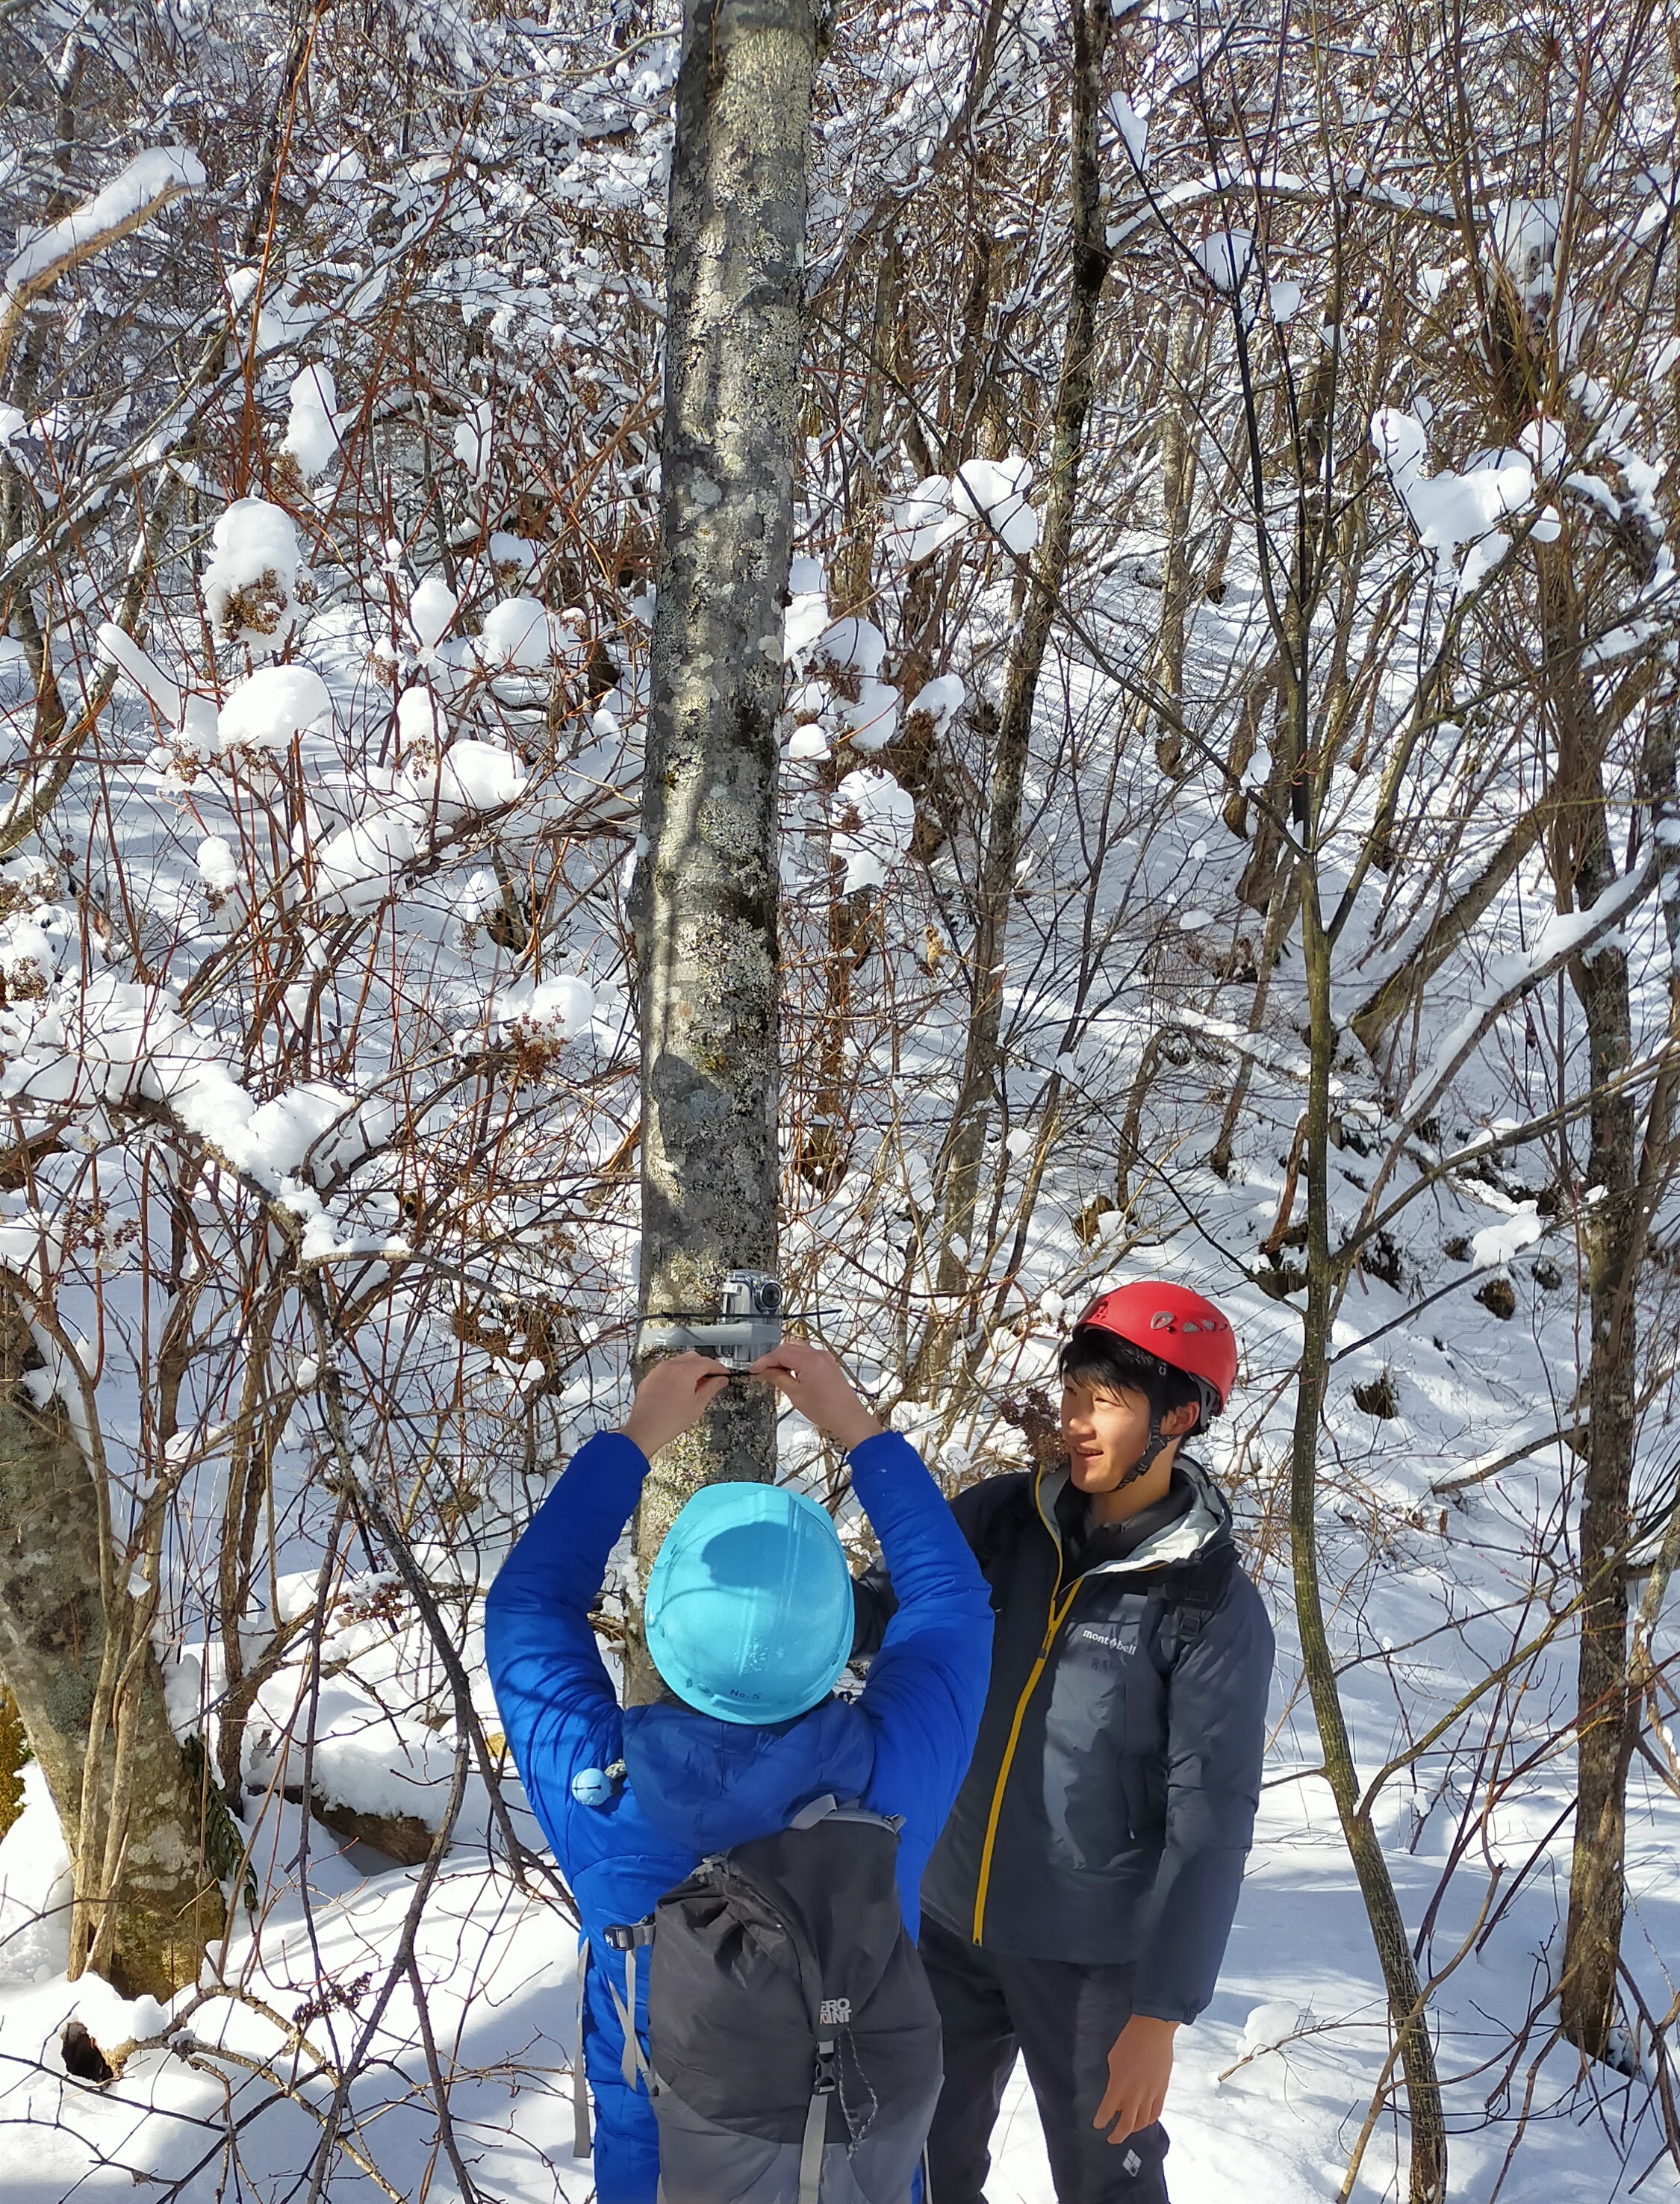
Fig.: Installation of time-lapse cameras to observe sediment production due to freeze-thaw action.

Fig.: A field experiment with a hydrophone and other equipment to observe bed load in Hodaka Sedimentation Observatory.
Sediment is produced in mountainous areas and transported to coastal areas through rivers. These processes are important factors to produce a safe, sound basin environment. With field observations, hydraulic experiments, and numerical analysis, we focus on sediment production mechanisms and sediment transport processes. The figure shows the field experiment with a hydrophone system and other equipment to observe bed load in the Hodaka Sedimentation Observatory. Recently, we have been focusing on application approaches such as data assimilation to predict the upstream reaches of the observation points.Video: Sediment removal work on the weir of the Hirudani subcatchment.
The Hodaka Sedimentation Observatory measures the amount of sediment deposited in the pool above the weir of the Hirudani sub-catchment in order to estimate the sediment discharge from the streams. This is one of the most valuable observations in the world for more than 55 years. On the other hand, the accumulated sediment has to be discharged by human power. In our laboratory, students stay at the observatory several times a year to carry out the sediment removal work (see the video). This is a valuable event that allows students not only to get a closer look at sediment transport by water but also to enjoy BBQ.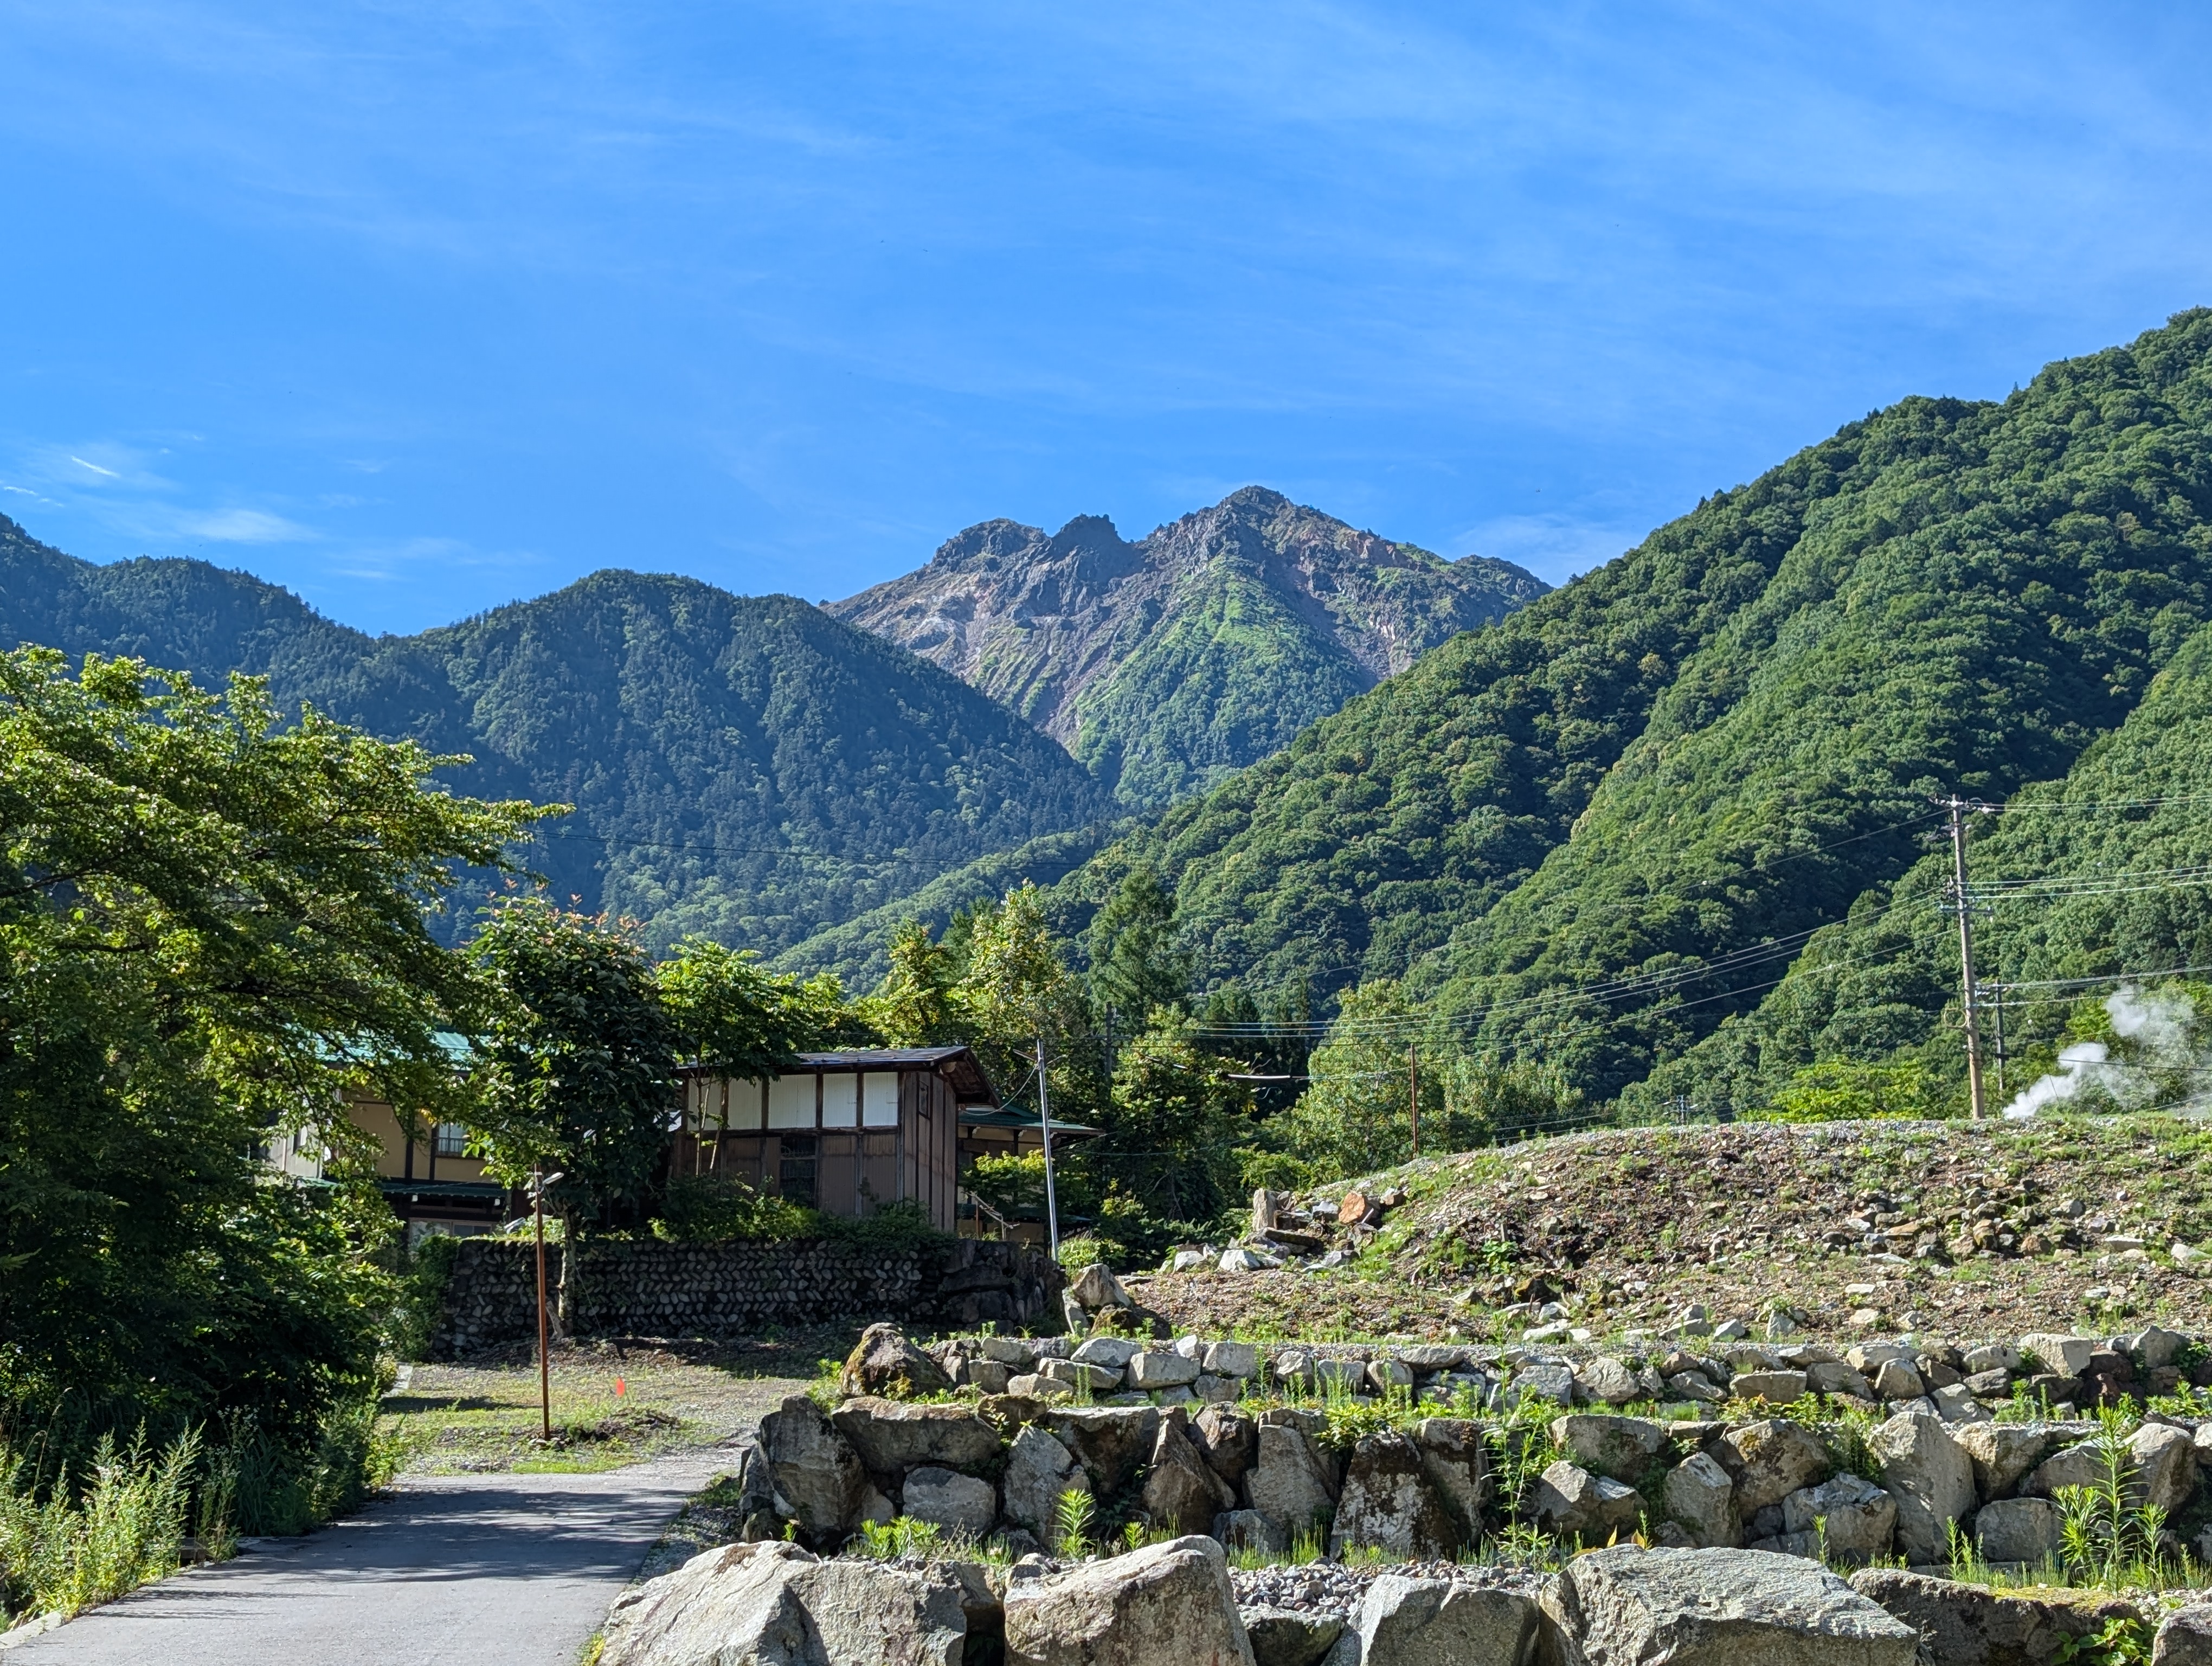
Fig.: Yakedake volcano
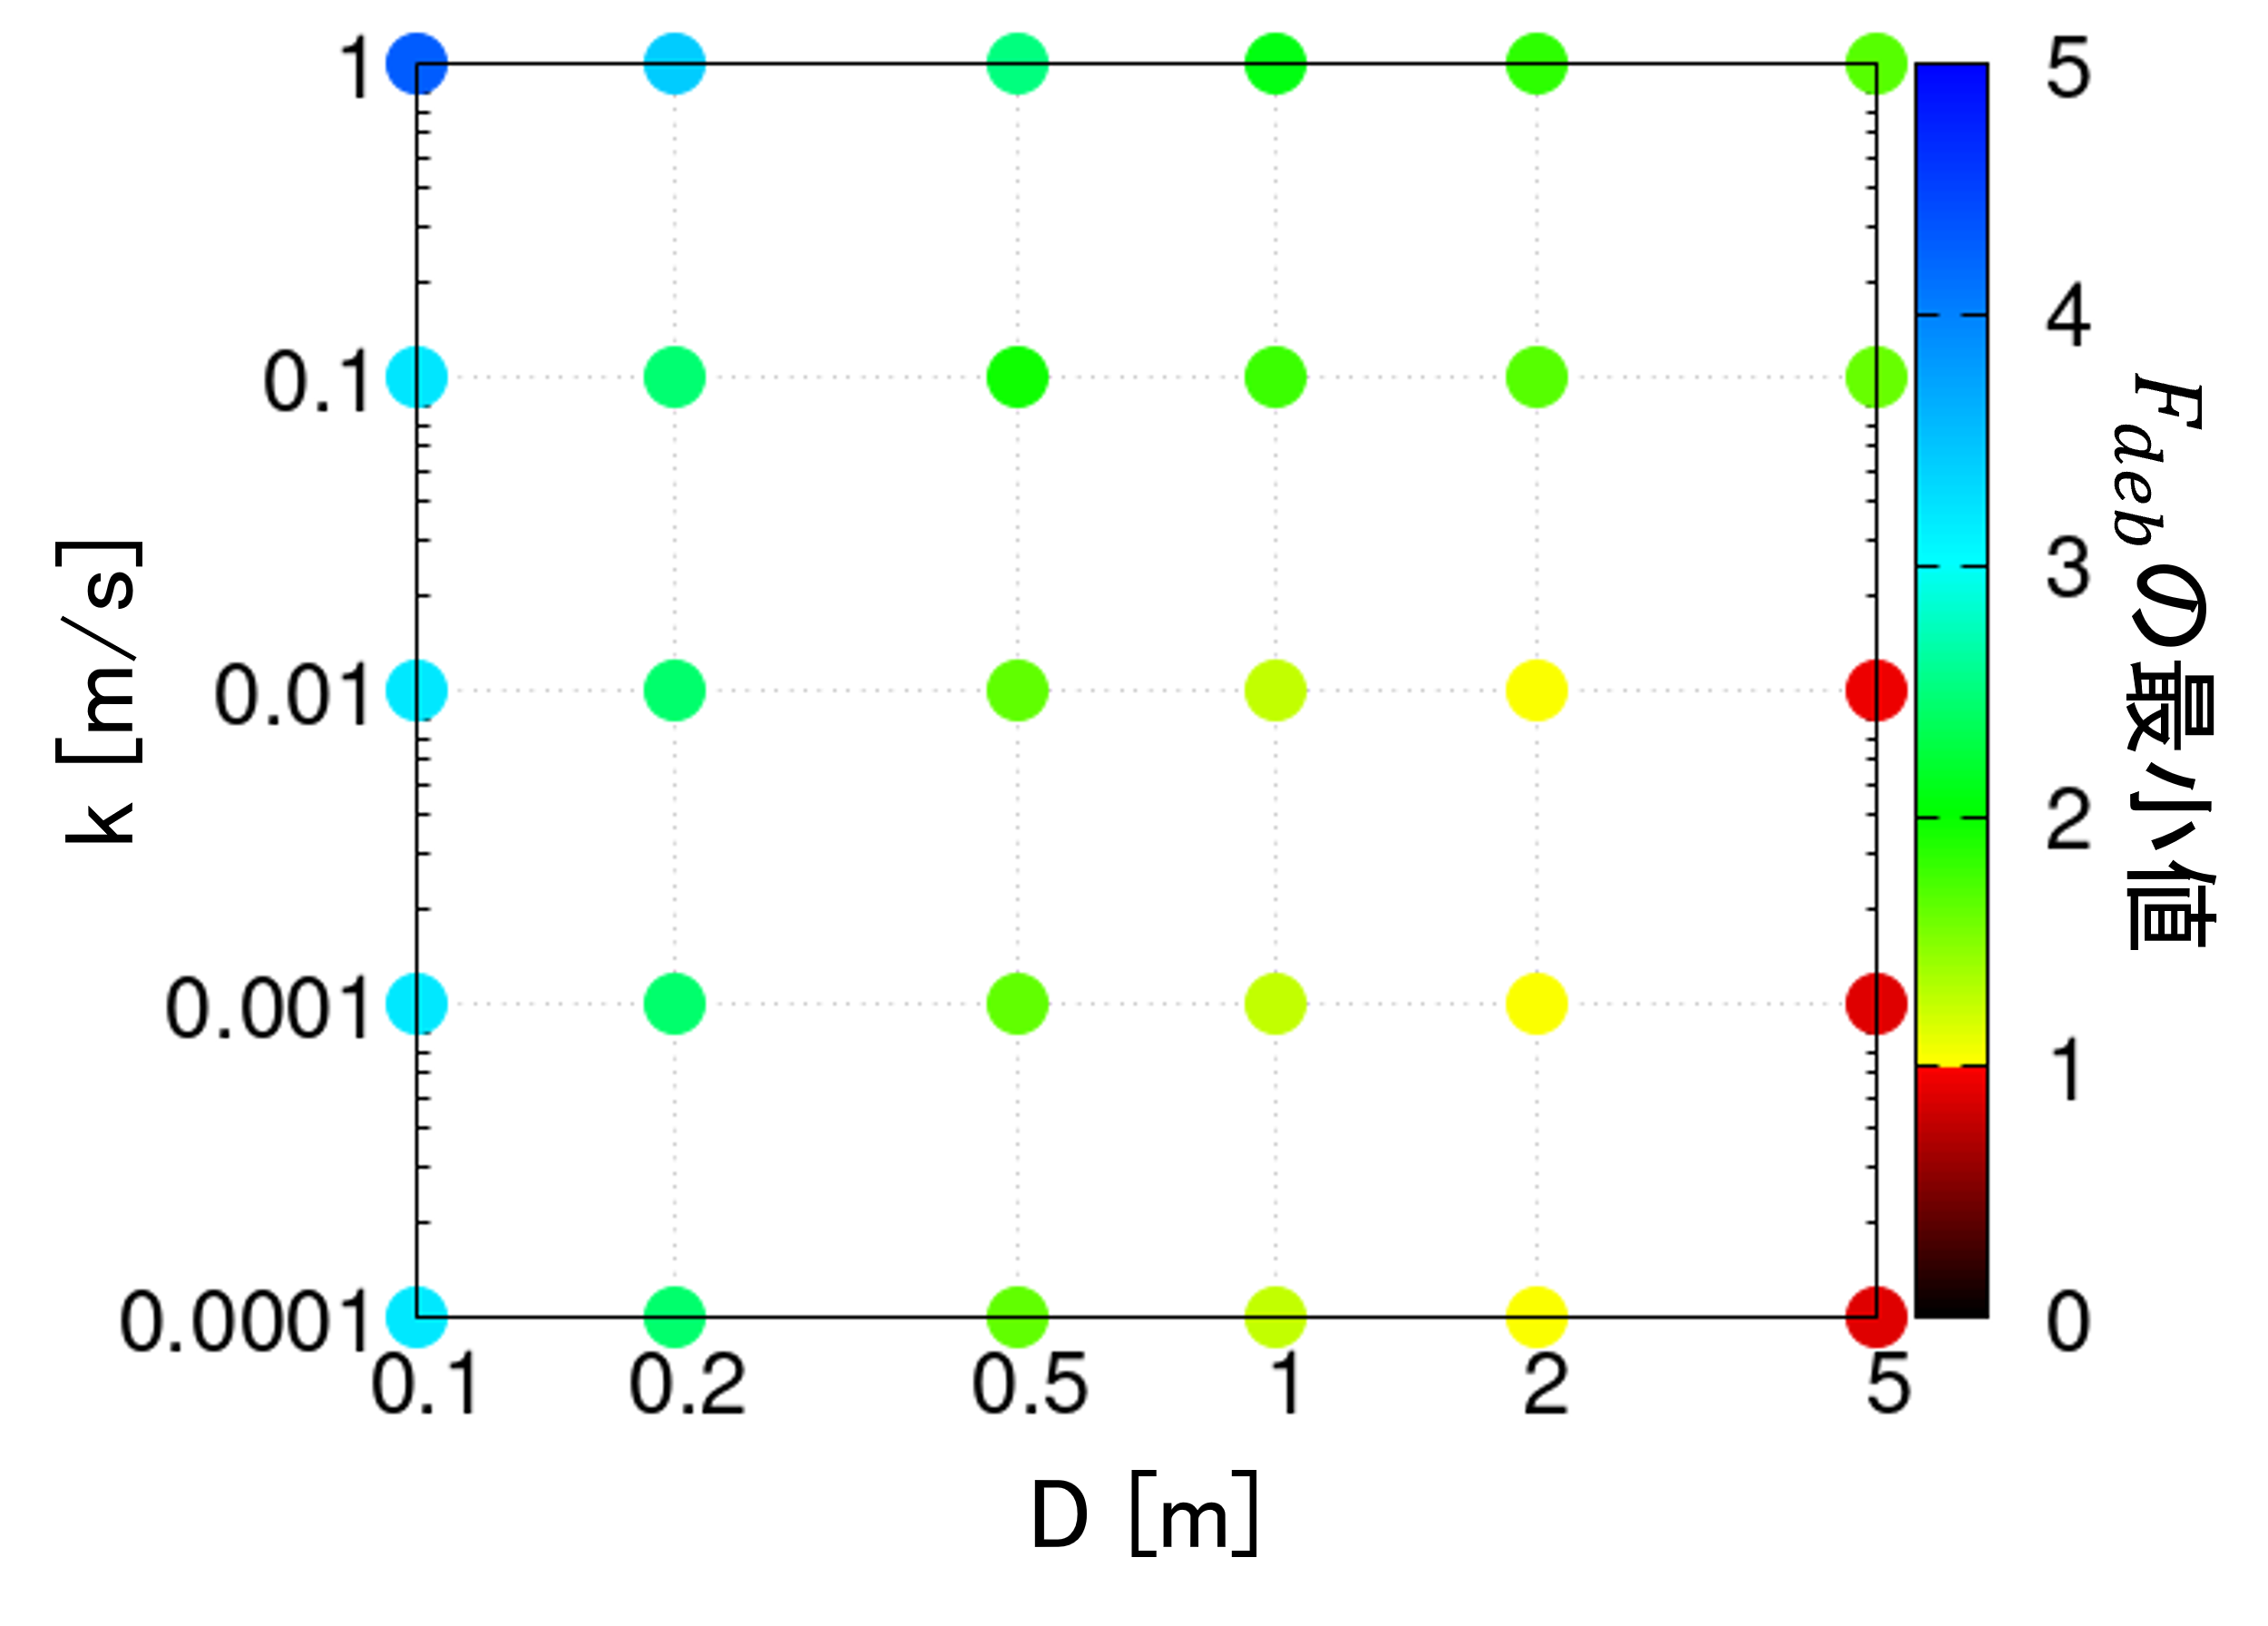
Fig.: Sensitivity analysis of soil layer thickness D, river bed hydraulic conductivity k, and the safety factor Fdeb for the occurrence of debris flow in 2020 using the prediction model [Iwai et al., 2024, Journal of JSECE].
In recent years, Mt. Yake-dake, which is located near the observatory, is in increase state in volucatic activity. If an eruption occurs in the future, sediment discharge is expected to become more active in the observation basin. In order to predict the debris flow occurance and sediment discharge after an eruption, we are developing a simulation model that can take into account changes in the soil layer caused by an eruption.Capturing all the sediment runoff from mountainous areas to coastal areas through rivers with structures is difficult. Therefore, land use should consider safe sediment runoff. Such as capturing large boulders and woody debris with sabo dams, controlling density and grain size, transporting safely into bypasses and channels, and using some parks for sedimentation areas. Applying field surveys, observations, and simulations, we aim to consider safe urban development in cooperation with not only the erosion control section but also rivers and reservoir sections.